
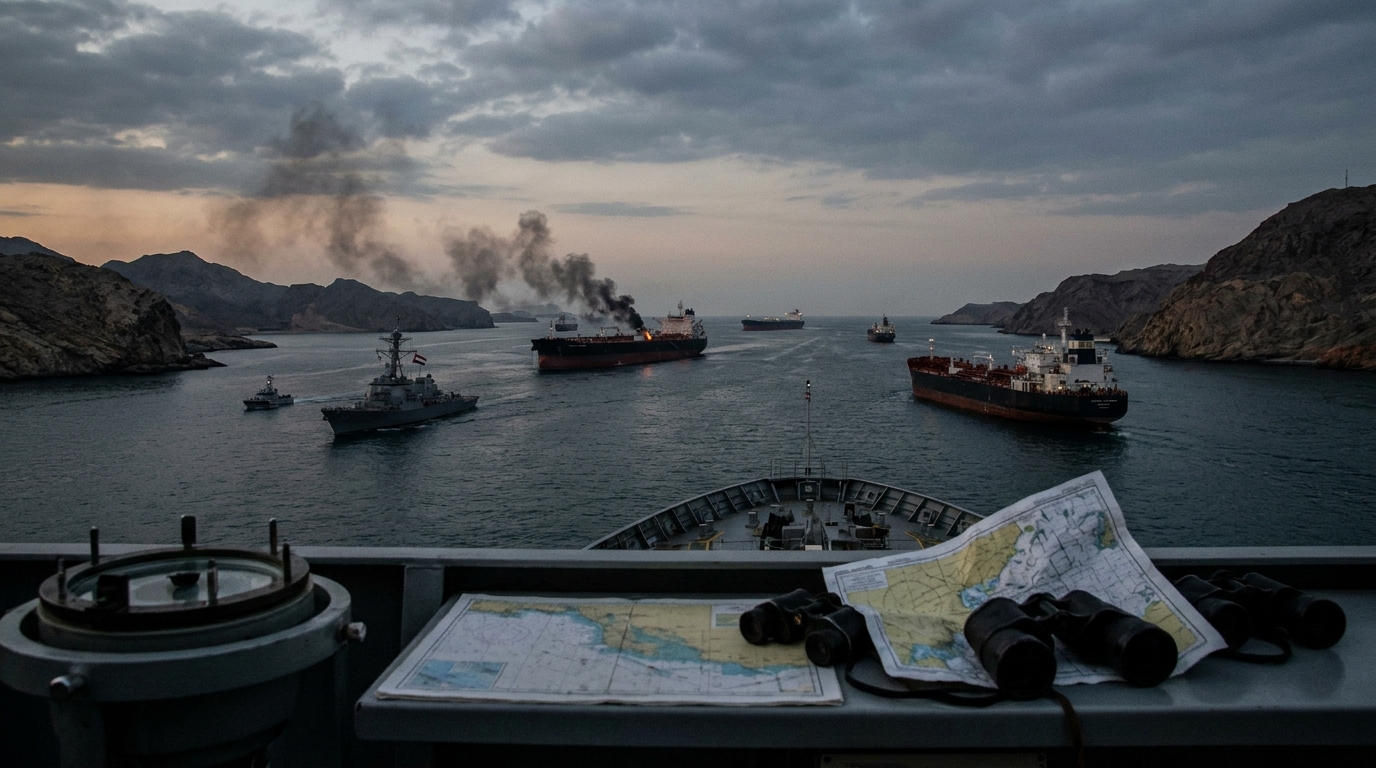
Three oil tankers caught fire in the Strait of Hormuz on Saturday after striking naval mines, according to Iranian state media. Iran’s navy said three tankers caught fire after hitting naval mines in the strait, with one struck in the eastern passage on Saturday morning and two others later in the day. The IRGC said the vessels had disabled their AIS transponders and switched off their radar and positioning systems and were attempting to pass through an unauthorized route. No identities were confirmed independently.
That is the fourth such incident in a week, following reports on November 8 and November 13. Taken together, they form the most concentrated run of tanker casualties since the conflict began. And yet Brent settled Friday at $95.84, down 2.5% for the week, its second consecutive weekly loss. The price and the physical market are now telling opposite stories.
What the Scoreboard Misses
IMF PortWatch counted 3 transits through the Strait of Hormuz on November 8, the latest published day. The 7-day average was 3.9 transits a day, about 5% of the 73.7-a-day average for the same period a year earlier. That is not a disruption. That is an effective closure.
The insurance market has priced it accordingly. Insurance Business reported on November 9 that pre-war hull war rates for Hormuz transits sat at around 0.15-0.25% of vessel value, and that brokers were quoting additional premiums for Gulf tankers at 6-10% of hull value in mid-October. For a $150 million tanker, that range translates to a single-transit insurance bill of between $9 million and $15 million. The Iran-Iraq tanker war of the 1980s, which damaged more than 450 ships over years, produced rates of roughly 5%. Hormuz quotes in 2026 have gone above that level more than once, with rates reaching 10% at several points.
So why is Brent falling?
The Price Is Not Wrong. It Is Answering a Different Question
Crude prices track expected net supply loss, not the cost of moving a barrel. Saudi crude shifted to Yanbu via the East-West pipeline and UAE barrels moved to Fujairah, blunting the physical shock that the transit numbers alone would imply. The IEA said Friday it expects the global market to return to a surplus this quarter. The US dollar rose to about 103.4 on the ICE US Dollar Index by Friday, adding further headwind.
Meanwhile, the selloff has also been driven by de-escalation hopes, with traders removing part of the premium attached to Middle Eastern supply disruptions. Markets heard a Qatari diplomatic channel open toward Washington last week. That was enough to deflate the risk premium faster than fresh mine strikes could rebuild it.
Where It Shows Up
The divergence is clearest in tanker equities. In the second quarter of 2026, Frontline, International Seaways, and Scorpio Tankers alone reported combined net income of roughly $1.52 billion. Frontline (FRO), DHT, International Seaways (INSW), and Scorpio Tankers (STNG) have all posted record or near-record quarters. The operators running the longest alternative routes, around the Cape of Good Hope, capture both the elevated freight rates and the war-risk surcharges passed through to charterers.
XOM and VLO face a different calculus. Refiners sourcing Gulf crude now absorb freight costs that the IEA has described as exceeding $37 a barrel to ship Gulf crude to Asia, more than five times the pre-war rate. That spread between paper-price Brent and all-in delivered cost is quietly compressing refiner margins even as the futures market looks calm.
Risks and Counterpoints
The bullish case for oil is straightforward: each additional mine strike tightens the window of diplomatic progress, and any failure of the Qatari channel could snap the risk premium back sharply. The Lloyd’s Market Association said in a March 23 market statement that war insurance remains available, describing safety rather than access as the real constraint, but that distinction collapses quickly if crew refusals spread.
The bearish case is that rerouting has worked better than the headlines suggest, and that physical market indicators point to slackness, with Dated Brent recently trading below prompt Brent futures, a classic signal of near-term oversupply in physical markets.
What to Watch Next
The number that settles the argument is not Brent, it is the IMF PortWatch weekly transit count. If the 7-day average stays below 5 through mid-November, the rerouting math gets harder to sustain. Watch also whether Lloyd’s syndicates begin withdrawing capacity rather than merely raising rates; 88% of Lloyd’s market participants surveyed after hostilities commenced said they still had appetite to underwrite hull war risk, but that survey predates the current run of mine strikes. Any reduction in underwriting capacity would force ships off the route regardless of what Brent futures say.